US public library usage during the 12 year window of the Great Recession show a dramatic increase between the 2009-2011 years. The Illinois public library usage in the areas of visits, circulation, and program attendance also show evidence of the Great Recession. This impact is primarily seen in the 2009-2011 years. The totals for the Illinois public library metrics for library visits, circulation, and program attendance are below. However, a closer look at data shows that not all Illinois public libraries appear to have been impacted equally by the Great Recession.
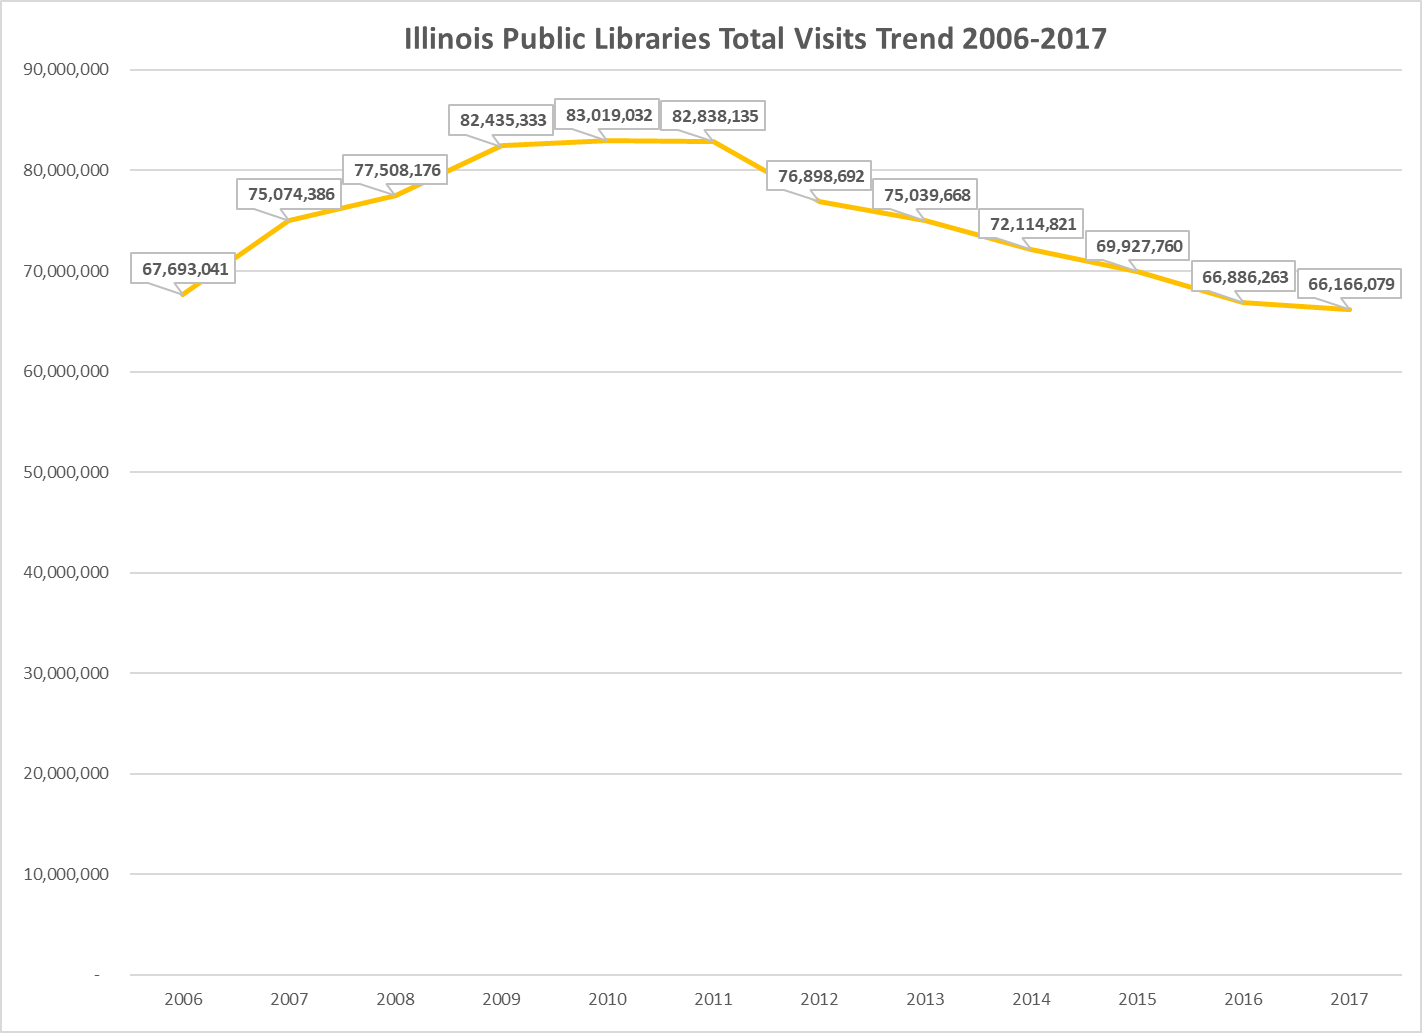
Illinois public library visits peaked in 2010, and for the seven years following the visits have fallen, and by 2017 are below the 2006 library visits total.

Illinois public library circulation totals also show 2010 as the highest year for this metric, as it was for library visits in 2010.
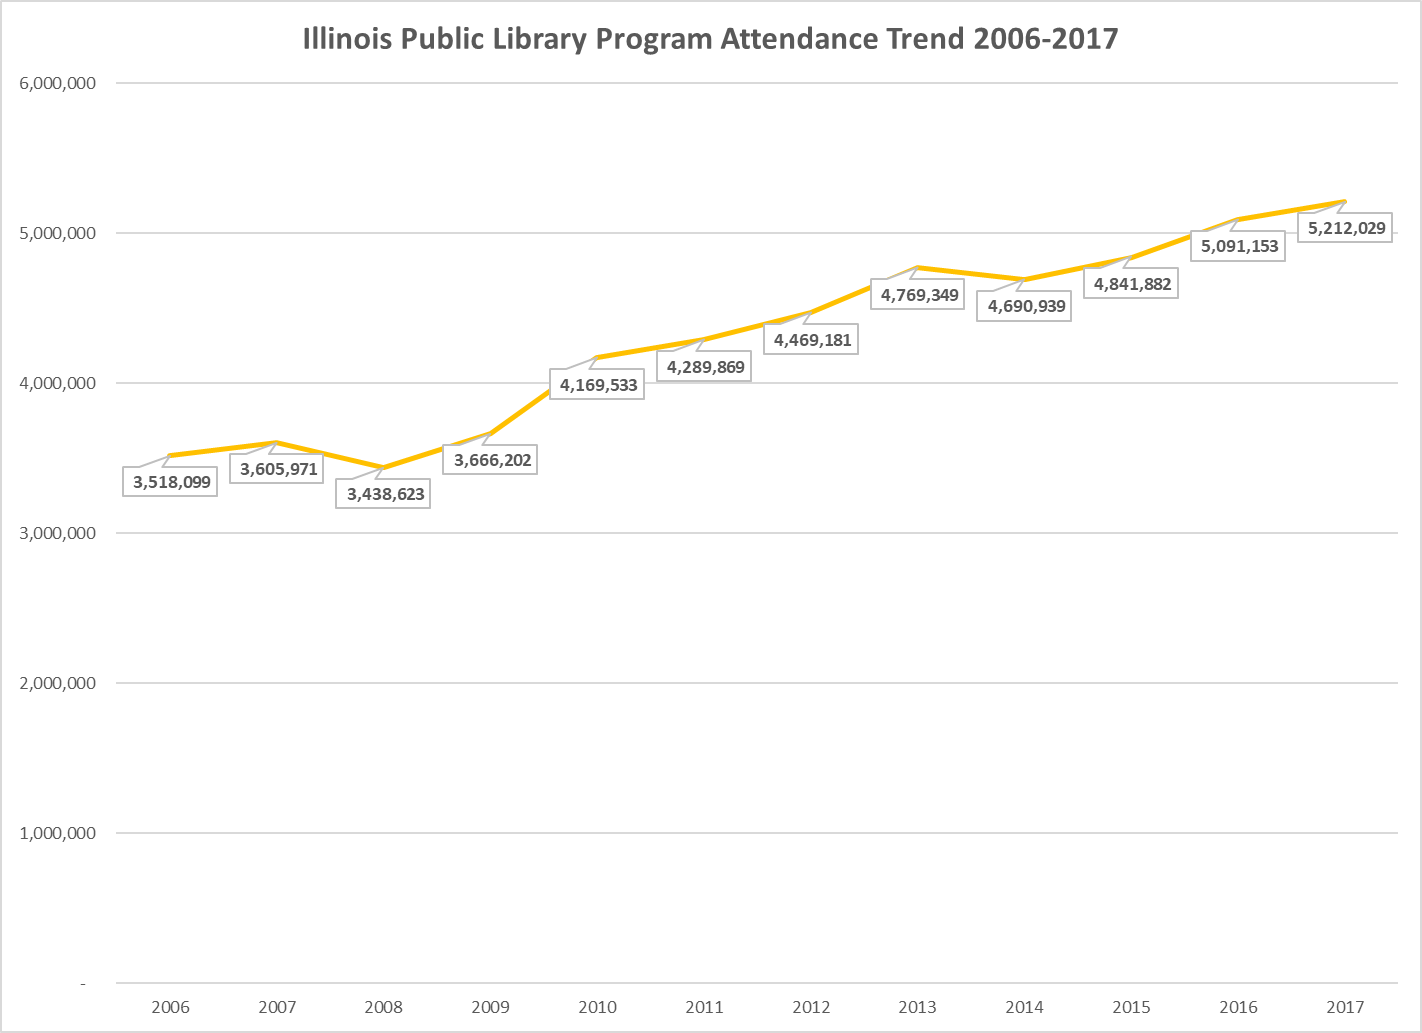
Library program attendance has largely defied the Great Recession impact, showing a modest increase over the 2008-2017 period. While this metric is a sign of success, it is worth pointing out that program attendance represents 0.4% of the total public library visits.

Chicago Public Library visits during the 12 years of 2006-2017 reflect the national trend of library visits peaking in 2009 and then falling each year after the Great Recession.

For the libraries serving large populations over 100,000 other than Chicago Public Library, the visits for the 2006-2017 period reflect the Great Recession trends, but not as clearly. The use of a graph also highlights some data anomalies, such as the Naperville Public Library visits in 2016 (see the top blue line which falls in 2016). Schaumburg Public Library also has a steep decline for the 2017 year, but this is the first year since 2008 in which visits data is not rounded to a broad number, which may reflect some change in how visits are recorded at the library.
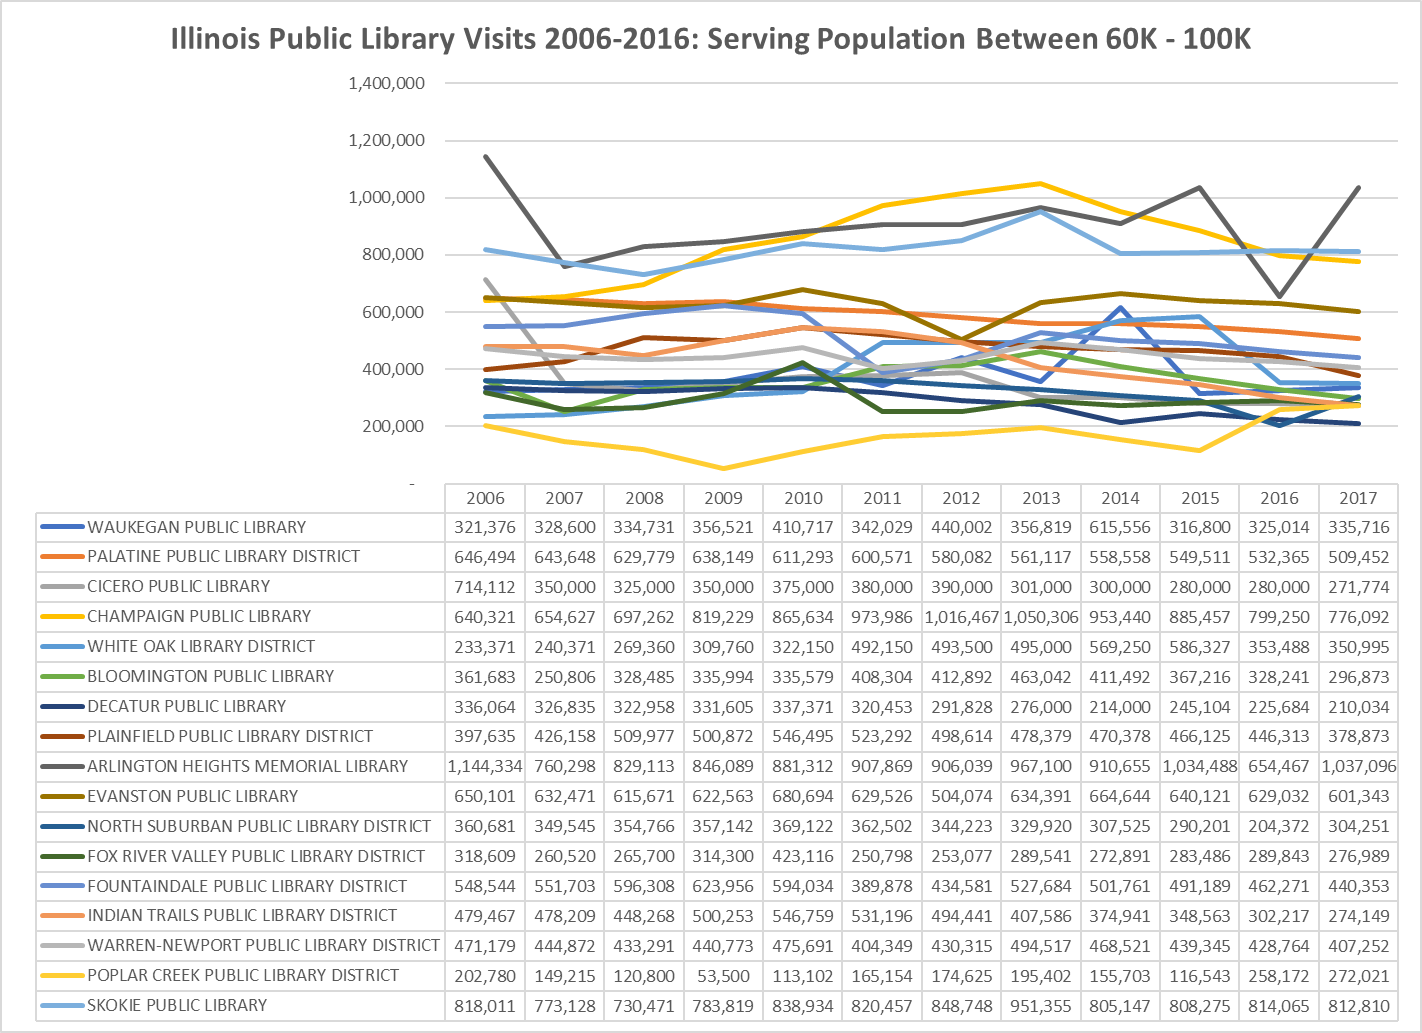
For the libraries serving a population between 60,000 and 100,000, the visits do not reflect the Great Recession trends overall. There again are some indications of data anomalies, such as the Arlington Heights 2016 library visits reported to IPLAR, but overall the trend for this group of libraries shows visits are holding steady compared to the other public libraries within this population group.
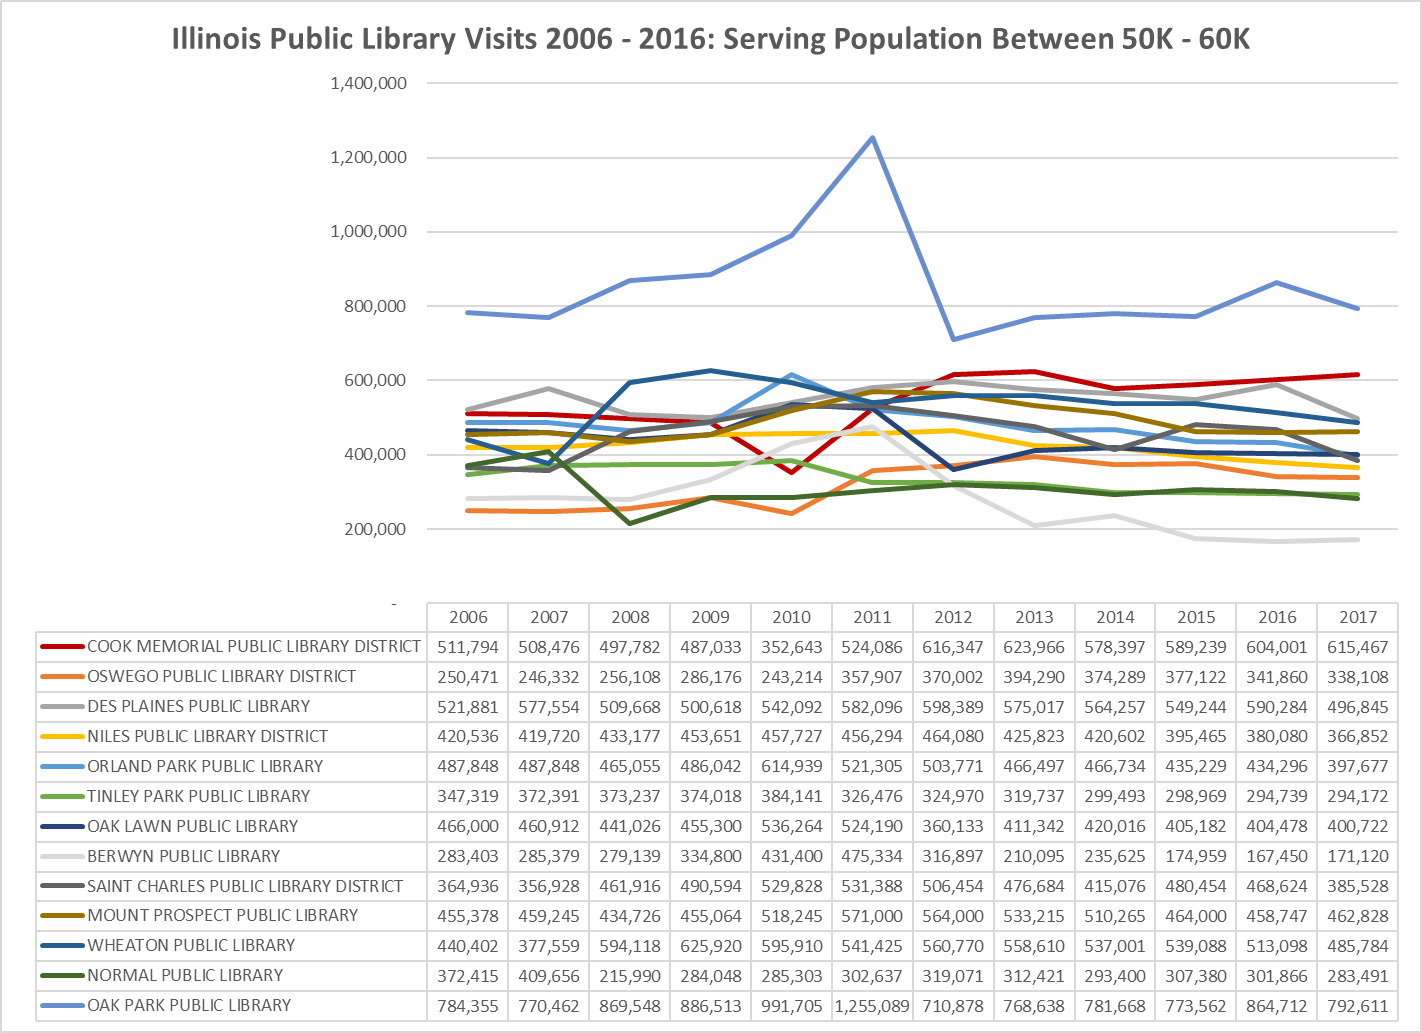
For the libraries serving a population between 50,000 and 60,000 there is a strong indication of the Great Recession in the 2011 year for the Oak Park Public Library. The visits for Oak Park Public Library are strong for this population group—showing this library is consistently is “punching above its weight.”
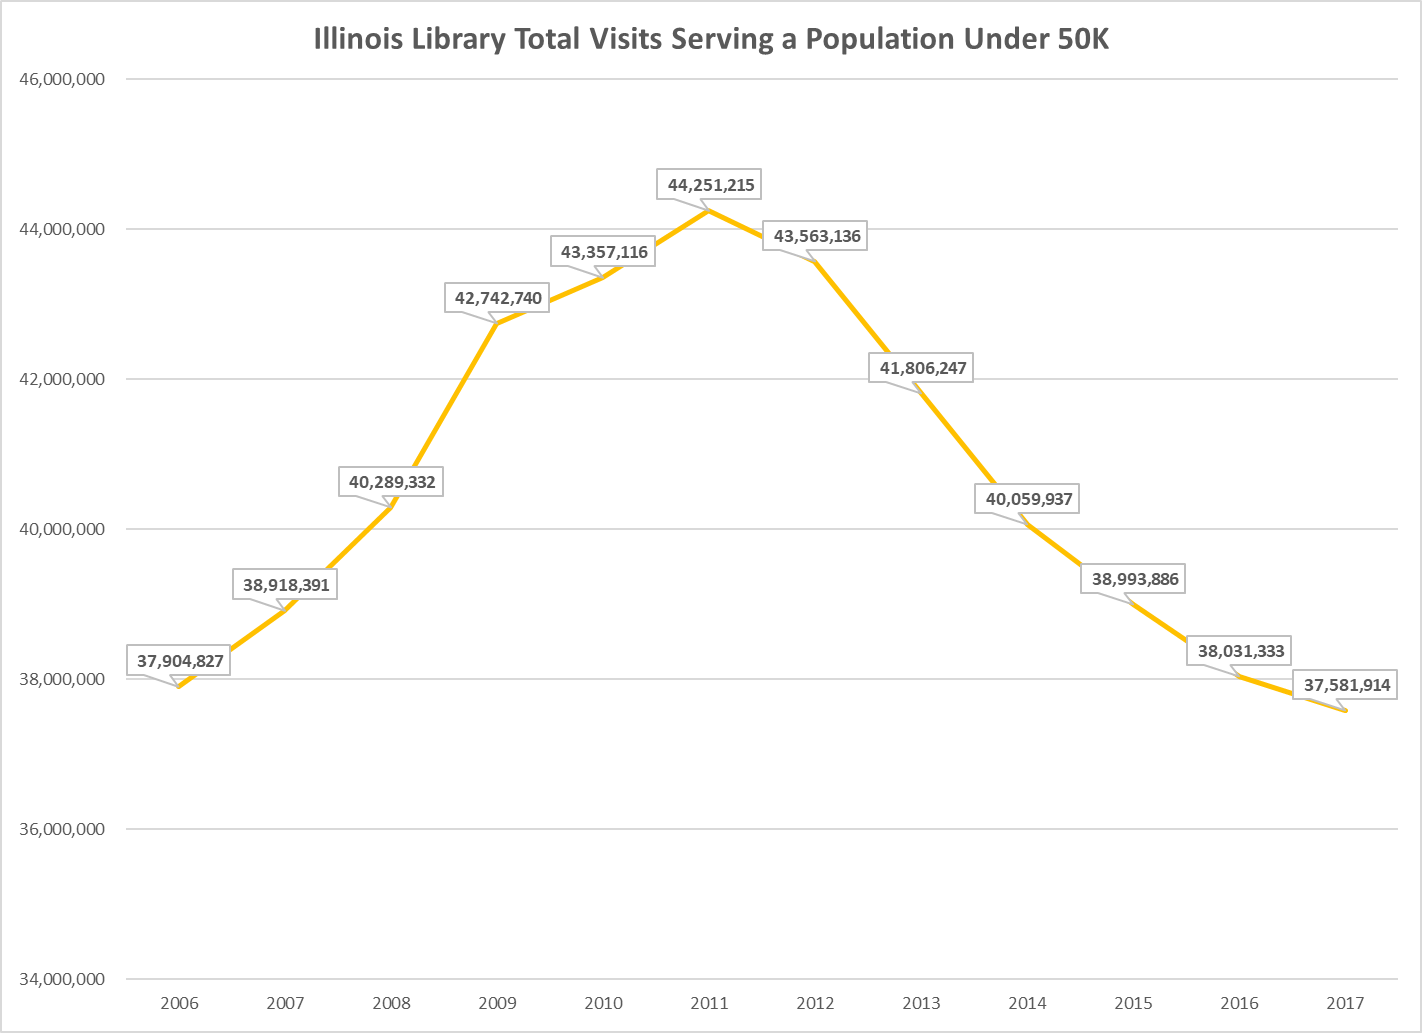
There are 583 Illinois public libraries under the 50,000-population threshold. Their combined library visits reflect a 2011 peak in library visits, two years after the US public library national trend.
In conclusion, the IMLS data for Illinois during the 12-year range of 2006-2017 shows the Great Recession impact for the Chicago Public Library, Oak Park Public Library, and those 583 combined libraries under the 50,000-service population. Those libraries above 50,000 population served (excluding the Chicago Public Library) do not show a Great Recession impact as dramatically.
Leave a Reply